Changing the Display Widget Type for a Value#
One can change the type of widget that displays values with the SmartDashboard. The allowable widgets depend on the type of the value being displayed.
Setting Edit Mode#
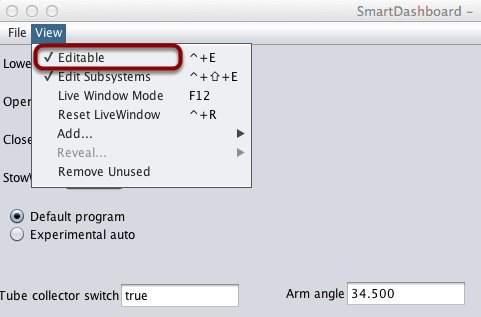
Make sure that the SmartDashboard is in edit mode. This is done by selecting Editable from the View menu.
Choosing Widget Type#

Right-click on the widget and select Change to.... Then, pick the type of widget to use for the particular value. In this case we choose LinePlot.
Showing New Widget Type#
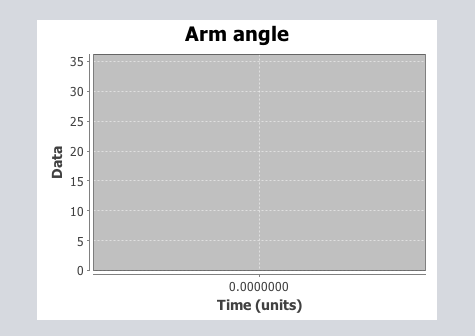
The new widget type is displayed. In this case, a Line Plot, will show the values of the Arm angle value over time. You can set the properties of the graph to make it better fit your data by right-clicking and selecting Properties.... See: Changing the display properties of a value.